Editor's note (2026-09 update): This post describes the real-time pipeline as it worked before v0.25. Beadbox no longer runs a WebSocket server — the app opens no network listener at all. Change events now travel over kkrpc on the sidecar's stderr. What you see as a user is unchanged: CLI writes still appear in the UI without a refresh. Only the mechanism moved. Any update-speed figures in this post are withdrawn too: how fast a change appears depends on the platform, and we no longer quote a number. You have five AI coding agents working a feature epic. Agent 1 is building the API layer. Agent 2 needs that API to wire up the frontend. Agent 3 is writing integration tests that depend on both. Agents 4 and 5 are handling migrations and docs, each blocked on different pieces.
This works for about twenty minutes. Then Agent 2 stalls because Agent 1 hit an unexpected schema problem. Agent 3 is now blocked on Agent 2, which is blocked on Agent 1. Agents 4 and 5 keep churning, but their work can't merge until the chain resolves. You don't find out until you wonder why nothing has shipped in an hour and start running bd blocked across every issue.
The dependency information exists. It lives in your issue tracker. But when you manage it through a CLI, you're reconstructing the graph in your head from flat text output. That reconstruction fails at exactly the moment it matters most: when the graph is complex and things are breaking.
How beads tracks dependencies
beads is a git-backed issue tracker built for AI agent coordination. It stores everything in a local Dolt database inside your repo's .beads/ directory. No cloud service, no accounts, no sync conflicts.
Agents declare dependencies with a single command:
bd dep add ISSUE-42 ISSUE-37
This records that ISSUE-42 depends on ISSUE-37. ISSUE-42 cannot proceed until ISSUE-37 closes. The inverse query is just as simple:
bd blocked
That returns every issue in the workspace currently blocked by an unresolved dependency. And for a specific issue:
bd dep list ISSUE-42
This shows what ISSUE-42 depends on and what depends on ISSUE-42.
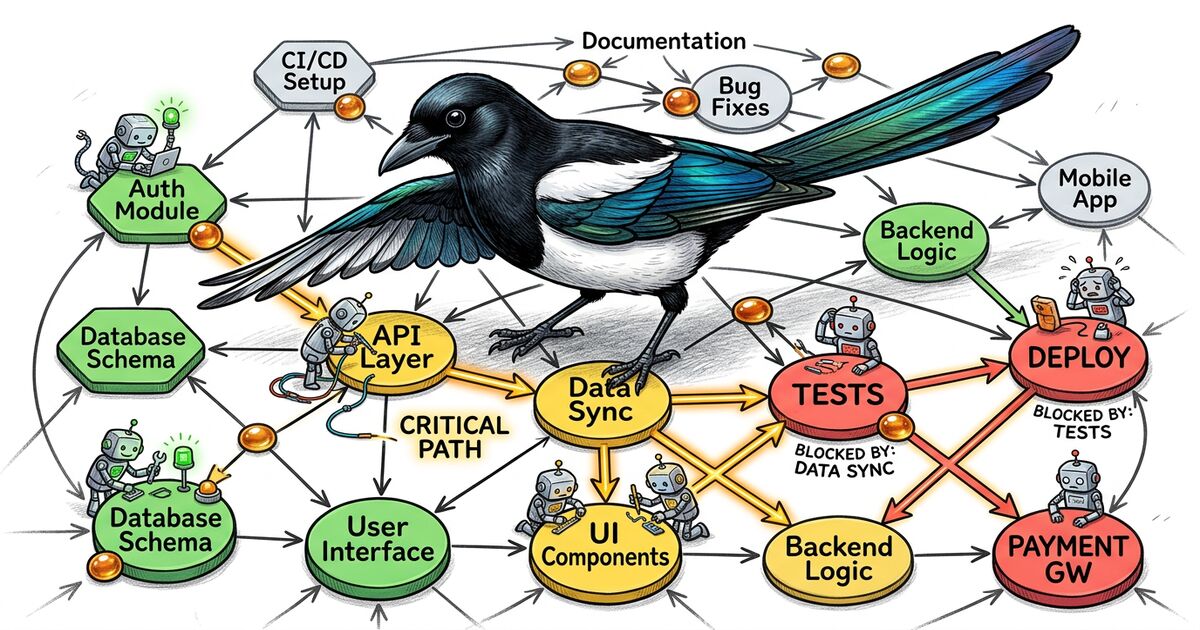
The data model is clean. The problem isn't recording dependencies. The problem is seeing them. When you have 30 active issues across five agents, running bd blocked gives you a list. A list doesn't show you that ISSUE-12 is a bottleneck blocking seven downstream tasks across three agents. A list doesn't show you that Agent 3 created a circular dependency chain between ISSUE-18 and ISSUE-22. You need a spatial view of the graph, not a sequential one.
What Beadbox shows you
Beadbox is a native desktop app that wraps the beads CLI with a visual interface. It reads from the same .beads/ database your agents write to, and it updates in real time as they work.
In the epic tree view, every issue that has unresolved dependencies shows a blocked badge inline. You see the full tree structure of your epic, with blocked issues marked at a glance. No command to run, no output to parse.
The dependency chain is visible spatially. If ISSUE-42 depends on ISSUE-37, and ISSUE-37 depends on ISSUE-15, and ISSUE-15 is assigned to Agent 1 which is stuck, you can trace that chain by scanning the tree. You see the shape of the bottleneck without reconstructing it from separate CLI queries.
The real-time piece matters. When Agent 1 finally closes ISSUE-15, the Beadbox UI reflects it within a second. The blocked badge on ISSUE-37 drops. If ISSUE-37 was the only thing blocking ISSUE-42, that badge drops too. You watch the dependency chain collapse as work completes, without refreshing or re-querying.
Under the hood, this works through a straightforward pipeline: a WebSocket server watches the .beads/ directory with fs.watch(). When any agent writes to the database (closing an issue, adding a dependency, updating status), the filesystem event triggers a broadcast to all connected clients. The React UI re-renders with fresh data. Sub-second latency from agent action to visual update.